2022 Q1 Vancouver Real Estate Recap: High Demand Pushing up Home Prices, Interest Rate Hike Threats Loom.

Record High Real Estate Prices
If you are looking to sell or buy your home right now, or just like to keep up with the real estate market, then you are definitely aware of how strong of a sellers market it has been lately. One of Canada’s most popular real estate news outlets, Better Dwelling, talks about how expensive Canadian real estate has become and the reasons behind it in a number of articles. In one article written, BMO chief economist explains that “central bank stimulus has driven record demand for housing at a turbulent time” hinting that monetary policies are what is driving up real estate prices, not supply. To summarize our most valuable takeaways from a number of recent articles on Better Dwelling:
- Current hyper-stimulus policies from the Bank of Canada are pushing forward more buyers to compete with existing ones, causing an “inventory squeeze”.
- Canadian real estate prices are directly linked to interest rates, which the bank has been “stress testing” in preparation for future forecasts.
- There is no supply shortage in Vancouver driving up house prices, housing growth is actually outpacing it’s population.
High Sales and Sales Ratios in Many Vancouver Neighbourhoods
Now, let’s dive into the specific areas and trends in Vancouver real estate over the first quarter of 2022. Vancouver is no different when it comes to looking at these real estate trends and the push in demand. Most Vancouver neighbourhoods are seeing tons of activity with extremely high sales and sales ratios. Because of this, many neighbourhoods and price bands are recording sales ratios above 100%.
- In Vancouver East, Champlain Heights, Main, and Renfrew condos & townhomes recorded 150%, 133% and 233% sales ratios respectively.
- Vancouver East condos & townhomes priced $1.5M-$1.75M had a 111% sales ratio in February.
- Vancouver West Condos and townhomes priced $600k-$700k had a 100% sales ratio
Condos and Townhomes In Vancouver Eastside are a Hot Commodity
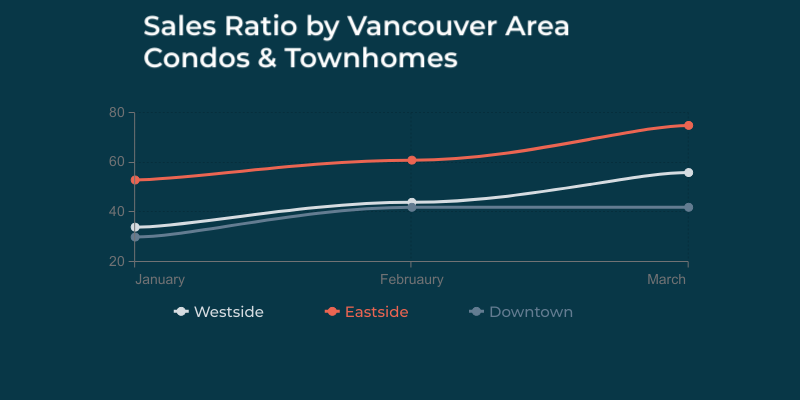
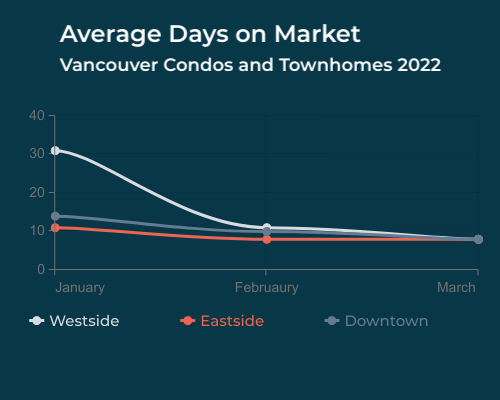
For the first three months of the year, condos and townhomes sales ratio in Vancouver East consistently ranked at the top. There is also an upward trend in sales ratios as they continue to climb throughout the first few months of the year. In January, Vancouver Eastside condos and townhomes recorded a 53% sales ratio, which then climbed to 75% in March. There was also a drastic drop in average days on market, from 11 days in January, to 8 in March. Below you can see an illustration of sales ratio trends by each area of Vancouver for Q1.


You can take a look at all listings available now in the Vancouver Eastside here!
Vancouver Westside Housing Movement
The Vancouver Westside is also showing increasing growth over the first quarter of the year. Detached house movement in Vancouver West saw a large increase in home sales. Homes in this area experienced a jump from 63 sales in January, to 121 total sales in March. This blog written by Ken Stef, highlights the recent detached house movement in Vancouver West. Here are the highlights:
- Average days on market dropped from 31 days to 11 days in February
- Westside homes priced $2.5M-$2.75M sold at a 58% sales ratio in February
- Kitsilano single family homes garnered the most attention with a 65% sales ratio


